Chelsea entered the latest international break with a slender advantage at the top of the Premier League table after winning five of their opening seven matches.
Pundits and fans alike predicted a close title race before the season began and it certainly looks like that will be the case, with just two points separating Chelsea in first from Manchester United in fourth.
Liverpool and Manchester City occupy second and third place respectively. What a battle we're in for.
At the other end of the table, four teams - Southampton, Burnley, Newcastle United and Norwich City - remain winless, with the Canaries propping up the rest with just one point.
Early evidence suggests Daniel Farke's side, who picked up their first point last Saturday, are in for a long season.
However, how would the table look if we looked at it in a different way?
Twitter account @xGPhilosophy, the self-proclaimed 'home of Expected Goals', has worked out the standings based on Expected Points.
Firstly, what are Expected Points, and how are they calculated.
@xGPhilosophy define it as: "Expected Points measures the number of points a team could have expected to have taken from a game, based on the scoring opportunities (xG) that they created and conceded in that game."
Is Ronaldo hurting Manchester United & Ole? | The Football Terrace
https://www.youtube.com/embed/BV4RWe193bo
They use an example from earlier on in the season, in which Man United defeated Wolves 1-0 despite losing the xG battle 2.01-0.66, to further explain the alternative points tally.
"Although Wolves lost the match, their xG indicated that they deserved more," they write.
"In this instance, Wolves collected 2.51 Expected Points and Man Utd collected 0.33 Expected Points."
So, with that out of the way, let's take a look at the 2021/22 Premier League table based on Expected Points.
1. Man City
- Expected: 17
- Actual: 14
2. Liverpool
- Expected: 15
- Actual: 15
3. Everton
- Expected: 14
- Actual: 14
4. Brentford
- Expected: 13
- Actual: 12
5. Manchester United
- Expected: 12
- Actual: 14
6. Chelsea
- Expected: 12
- Actual: 16
7. West Ham
- Expected: 12
- Actual: 11
8. Wolves
- Expected: 11
- Actual: 9
9. Crystal Palace
- Expected: 10
- Actual: 7
10. Brighton & Hove Albion
- Expected: 9
- Actual: 14
11. Aston Villa
- Expected: 8
- Actual: 10
12. Leicester City
- Expected: 8
- Actual: 8
13. Arsenal
- Expected: 8
- Actual: 10
14. Leeds United
- Expected: 7
- Actual: 6
15. Burnley
- Expected: 7
- Actual: 3
16. Tottenham Hotspur
- Expected: 7
- Actual: 12
17. Southampton
- Expected: 7
- Actual: 4
18. Newcastle United
- Expected: 6
- Actual: 3
19. Watford
- Expected: 6
- Actual: 7
20. Norwich City
- Expected: 5
- Actual: 1
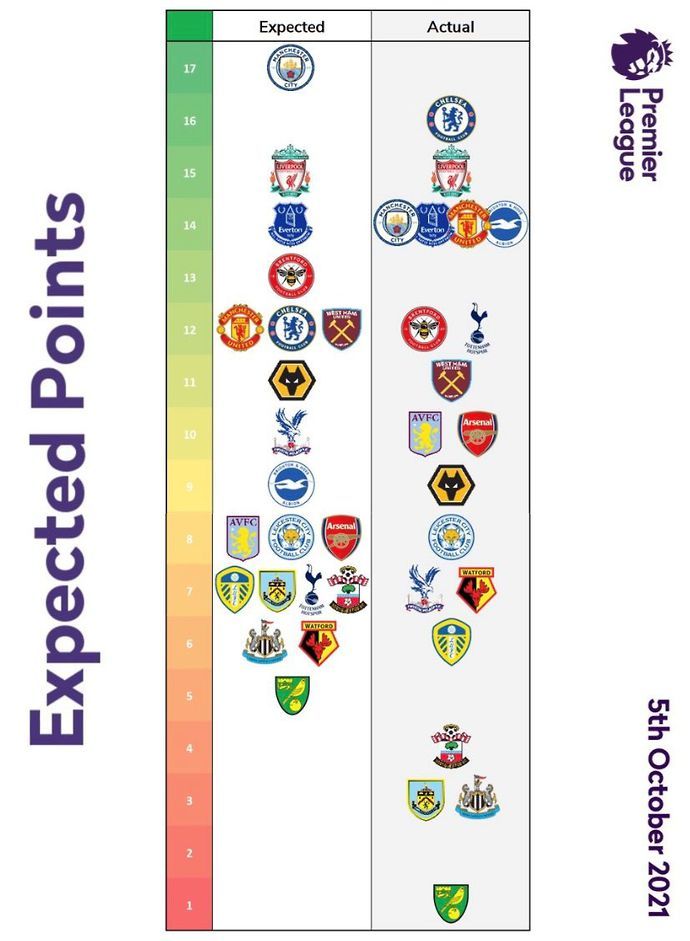
The below graphic shows how teams' expected points compare to their actual points.
So Man City have three fewer points than expected, something that Chelsea have capitalised on by recording four more points than their xP.
Elsewhere, Brentford are expected to have more points than Thomas Tuchel's side. Just imagine if they really were fourth in the table.
Brighton's expected points tally of nine - five fewer than they actually have - suggests they will soon start dropping to a mid-table position, while Norwich remain in bottom place.


